Write down the constraint inequalities.
Adding the protein:
\begin{align*}
(4)x + (3)y \geq \text{15}
\end{align*}
Adding the carbohydrates:
\begin{align*}
(16)x + (24)y \geq \text{72}
\end{align*}
There are at most 5 packets of cereal available:
\begin{align*}
x + y & \leq 5
\end{align*}
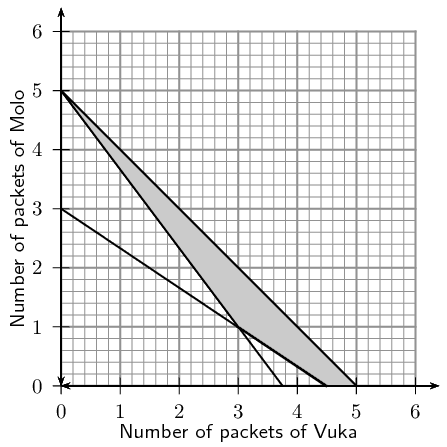
If Vuka cereal costs \(\text{R}\,\text{6}\) per packet and Molo cereal also costs \(\text{R}\,\text{6}\) per packet, use the graph to determine how many packets of each cereal must be used so that the total cost for the mixture is a minimum.
The objective function can be written as follows:
\begin{align*}
P = & (\text{profit per packet of Vuka}) \times (\text{number of packets of Vuka}) + (\text{profit per packet of Molo}) \times (\text{number of packets of Molo})\\
P = & (\text{6})x + (\text{6})y
\end{align*}
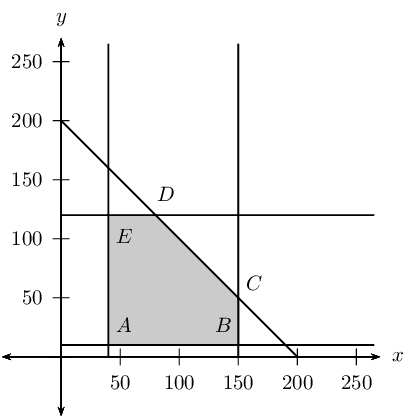
The vertices of the feasible region are as follows:
\begin{align*}
\text{Point A: } & (\text{3};\text{1}) \\
\text{Point B: } & (\text{4,5};\text{0}) \\
\text{Point C: } & (\text{5};\text{0}) \\
\text{Point D: } & (\text{0};\text{5})
\end{align*}
The cost at each vertex is as follows:
\begin{align*}
\text{Point A: } P & = \text{6}(\text{3}) + \text{6}(\text{1}) = \text{24} \\
\text{Point B: } P & = \text{6}(\text{4,5}) + \text{6}(\text{0}) = \text{27} \\
\text{Point C: } P & = \text{6}(\text{5}) + \text{6}(\text{0}) = \text{30} \\
\text{Point D: } P & = \text{6}(\text{0}) + \text{6}(\text{5}) = \text{30}
\end{align*}
To minimize the objective function select Point A. The minimum possible cost of \(\text{R}\,\text{24}\) can be made if \(\text{3}\) packets of Vuka and \(\text{1}\) packets of Molo are sold.
Use the graph to determine how many packets of each cereal must be used so that the total cost for the mixture is a maximum (give all possibilities).
To maximize the objective function select Point C, or Point D. The maximum possible cost of \(\text{R}\,\text{30}\) can be made if either \(\text{5}\) packets of Vuka and \(\text{0}\) packets of Molo are sold, or \(\text{0}\) packets of Vuka and \(\text{5}\) packets of Molo are sold.