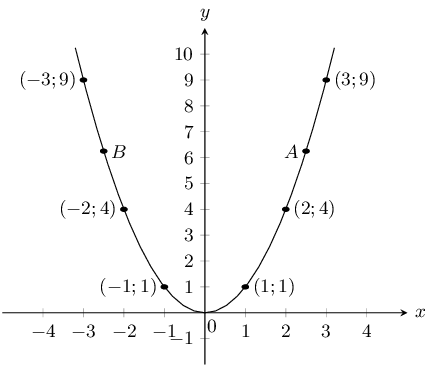
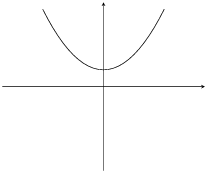
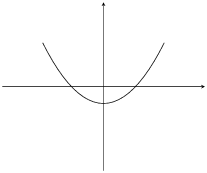
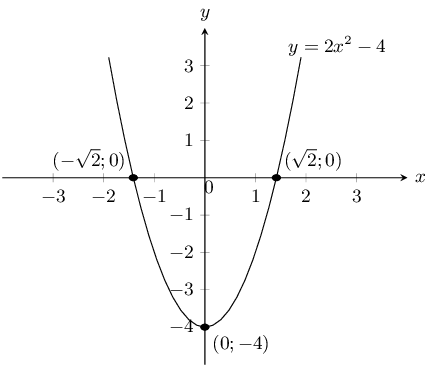
The graph below shows a quadratic function with the following form: \(y = ax^2 + q\).
Two points on the parabola are shown: Point A, the turning point of the parabola, at
\((0;4)\), and Point B is at \(\left(2; \frac{8}{3}\right)\). Calculate the values of
\(a\) and \(q\).
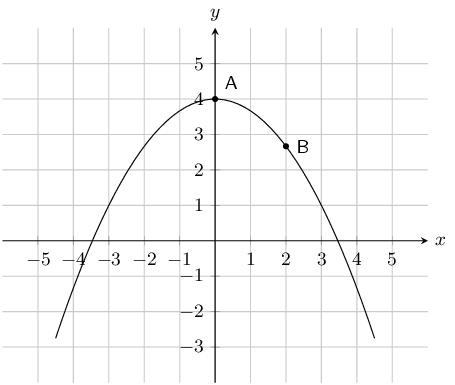
The value of \(q\) is 4.
\begin{align*}
y & = ax^2 +4 \\
\left( \frac{8}{3} \right) & = a(\text{2})^2 +4 \quad \longleftarrow \quad ^{\text{substitute in
the}}_{\text{coordinates of a point!}} \\
\frac{8}{3} & = \text{4}a +4 \\
\frac{8}{3} -4 & = \text{4}a \\
- \frac{4}{3} & = \text{4}a \\
- \frac{1}{3} & = a
\end{align*}
\[a = - \frac{1}{3};~ q = 4\]
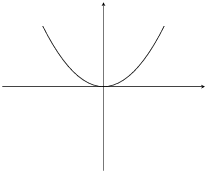
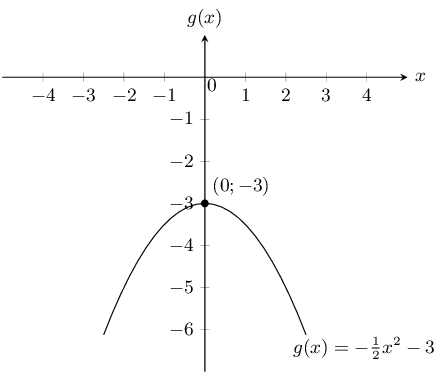
The graph below shows a quadratic function with the following form: \(y = ax^2 + q\).
Two points on the parabola are shown: Point A, the turning point of the parabola, at
\((0;-3)\), and Point B is at \(\left(2; 5\right)\). Calculate the values of \(a\) and
\(q\).
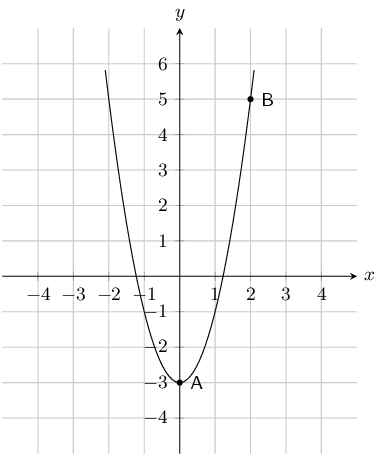
The value of \(q\) is -3.
\begin{align*}
y & = ax^2 -3 \\
\left( 5 \right) & = a(\text{2})^2 -3 \quad \longleftarrow \quad ^{\text{substitute in
the}}_{\text{coordinates of a point!}} \\
5 & = \text{4}a -3 \\
5 +3 & = \text{4}a \\
8 & = \text{4}a \\
2 & = a
\end{align*}
\[a = 2;~ q = -3\]
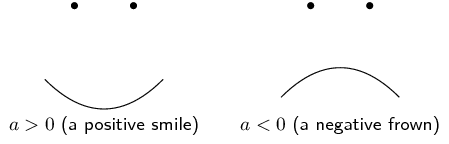
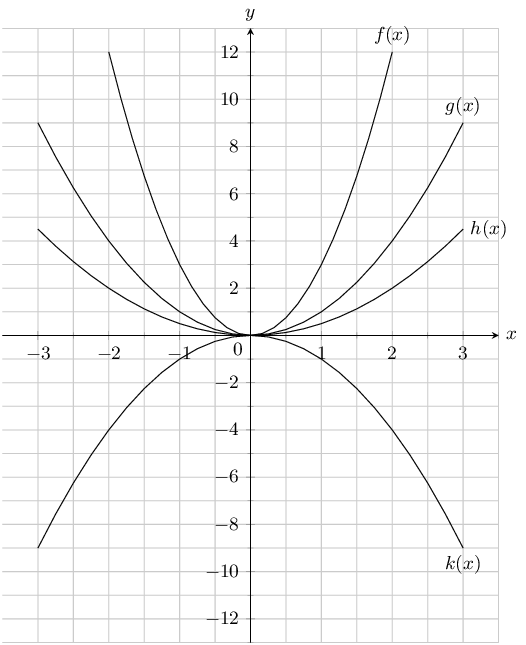
Show that if \(a < 0\) the range of \(f(x)=ax^2 + q\) is \(\left\{f(x):f(x) \le q\right\}\).
Because the square of any number is always positive we get: \(x^2 \geq 0\).
If we multiply by \(a\) where \((a < 0)\) then the sign of the inequality is reversed: \(ax^2 \le
0\)
Adding \(q\) to both sides gives \(ax^2 + q \le q\)
And so \(f(x) \le q\)
This gives the range as \((-\infty; q]\).
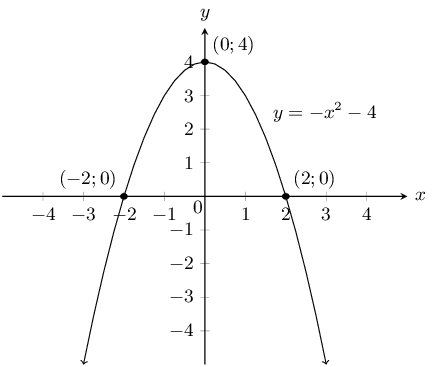
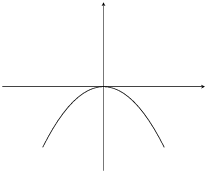
Draw the graph of the function \(y=-x^2 + 4\) showing all intercepts with the axes.
The \(y\)-intercept is \((0;4)\). The \(x\)-intercepts are given by setting \(y = 0\):
\begin{align*}
0 & = -x^2 + 4 \\
x^2 & = 4 \\
x & = \pm 2
\end{align*}
Therefore the \(x\)-intercepts are: \((2;0)\) and \((-2;0)\).
Now we can sketch the graph: