23.2 Analysing and interpreting global graphs
A graph is a graphical representation of the relationship between two variables. The independent variable is not affected by changes in the other variable. The independent variable is plotted on the horizontal axis. The dependent variable is influenced by the other variable. The relationship between the two variables determines how the value of the dependent variable changes. The dependent variable is plotted on the vertical axis.
- independent variable
- a variable that is not affected by changes in the other variable in a relationship
- dependent variable
- a variable that is influenced by, and changes in a way that depends on the relationship with the other variable
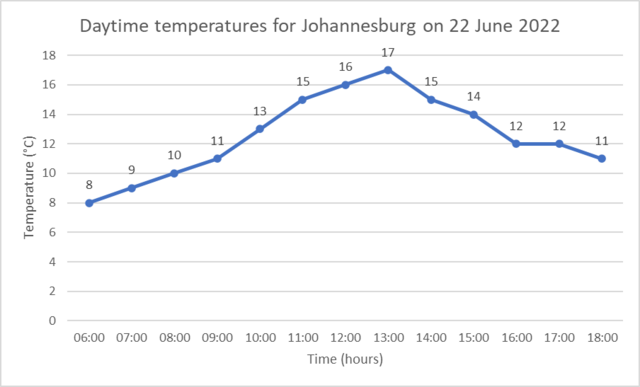
The graph below shows the change in daytime temperature for Johannesburg on 22 June 2022. In this example, time is the independent variable and temperature is the dependent variable. What the temperature is depends on the time at which the temperature was measured.
Elements of a graph
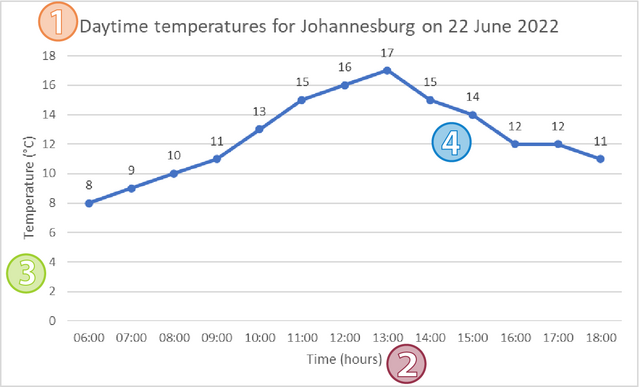
There are a number of elements that every graph should have:
- a title
- axis label and units for the independent variable (on the horizontal axis)
- axis label and units for the dependent variable (on the vertical axis)
- a plot showing the change in values of the dependent variable.
Linear graphs
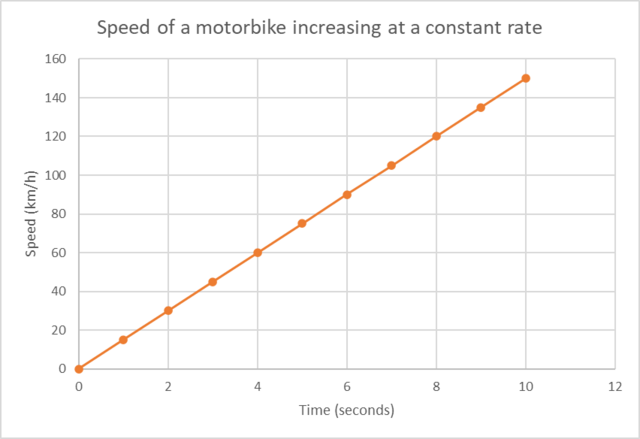
A linear graph (also called a straight-line graph) shows that the relationship between the independent variable and dependent variable is a straight line.
- linear graph
- a graph that is a straight line
The linear graph below shows the speed of a motorbike increasing at a constant rate (constant acceleration).
Increasing and decreasing linear graphs
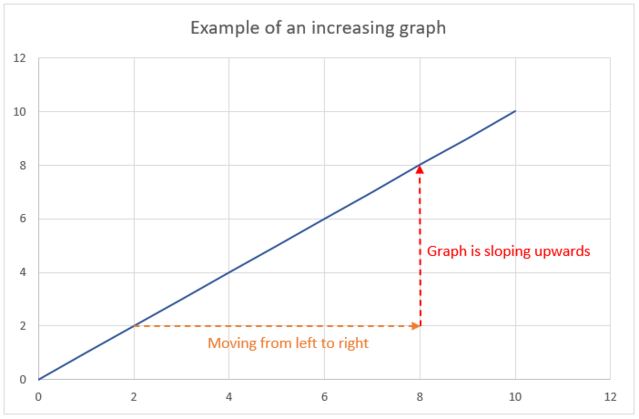
If a graph slopes upwards when moving from left to right, then it is called an increasing graph. In other words, if the dependent variable increases as the independent variable increases, then the graph is increasing.
- increasing graph
- a graph that slopes upwards from left to right, indicating that the dependent variable increases as the independent variable increases
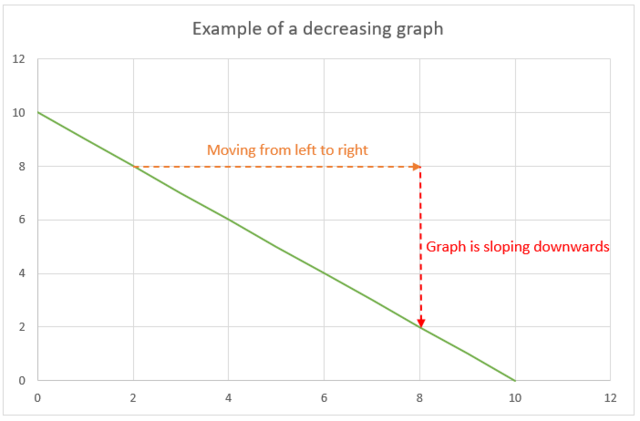
If a graph slopes downwards when moving from left to right, then it is a decreasing graph. In other words, if the dependent variable decreases as the independent variable increases, then the graph is decreasing.
- decreasing graph
- a graph that slopes downwards from left to right, indicating that the dependent variable decreases as the independent variable increases
Constant graphs
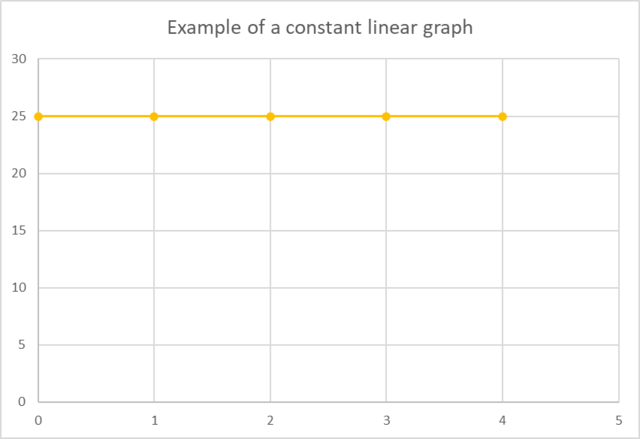
For a constant linear graph, the dependent variable does not change as the independent variable increases. The value of the dependent variable remains constant.
- constant
- staying the same; not changing
Non-linear graphs
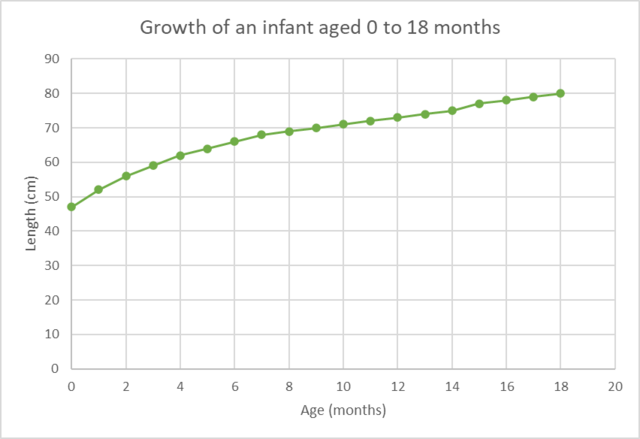
The curve below is an example on a non-linear graph. Notice that the graph is a curve and not a straight line. The graph shows the measured growth (length in centimetres) of an infant from birth to 18 months old.
- non-linear graph
- a graph that is not a straight line
Worked example 23.1: Interpreting data from a global graph

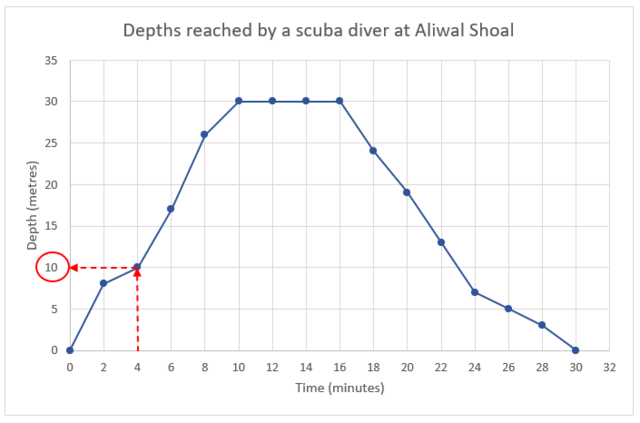
Aliwal Shoal in KwaZulu-Natal is one of the best scuba-diving spots in South Africa. The graph shows the depths that a scuba diver reached during a 30 minute dive.
Use the graph to answer the questions.
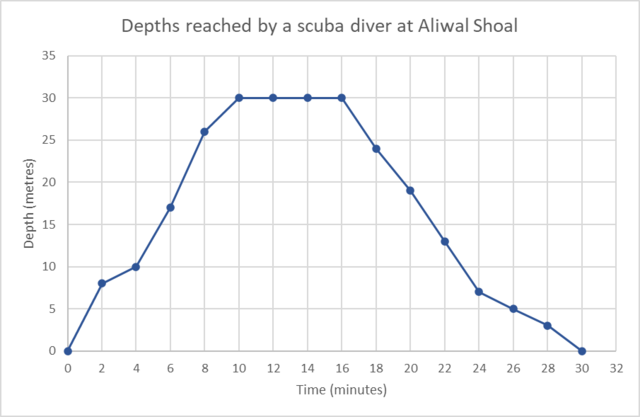
- How long was the scuba diver under the water?
- What was the scuba diver’s depth after 4 minutes?
- How long did the scuba diver spend at a depth of 30 metres?
- Complete each sentence by filling in the missing words:
- Between 0 and 10 minutes the depth of the scuba diver is ______ .
- Between 10 and 16 minutes the depth of the scuba diver remains ______ .
- Between 16 and 30 minutes the depth of the scuba diver is ______ .
Use the graph to find the total time.
Time is shown in minutes on the horizontal axis. We see that the graph starts at 0 minutes and the last point is at 30 minutes. So the scuba diver was under the water for 30 minutes.
Use the graph to find the depth after 4 minutes.
First we need to find 4 minutes on the horizontal axis and then move vertically upwards until we reach the graph. At that point, we move parallel to the horizontal axis until we reach the vertical axis and read the corresponding depth. The scuba diver’s depth after 4 minutes was 10 metres.
Use the graph to determine how long the scuba diver stayed at a depth of 30 metres.
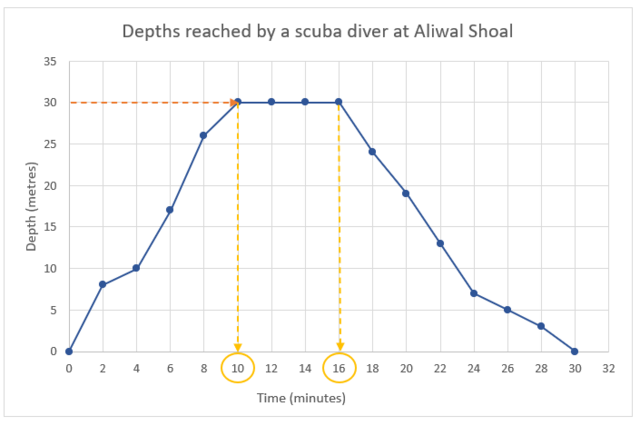
First we need to find 30 metres on the vertical axis and then move horizontally until we reach the graph. At that point, we move vertically downwards until we reach the horizontal axis and read the corresponding times.
The scuba diver stayed at 30 metres for \(16 − 10 = 6\) minutes.
Use the graph to complete each sentence.
- Between 0 and 10 minutes the depth of the scuba diver is increasing.
- Between 10 and 16 minutes the depth of the scuba diver remains constant.
- Between 16 and 30 minutes the depth of the scuba diver is decreasing.