20.4 Report data
As you have learnt, the data handling process is about gathering, recording, representing and analysing
information, and then presenting it in a way that is easily understood and used by other people. People carry
out this process when they want a question answered or to find something out. They might want to do research on
a particular topic, make better decisions, improve a business’s success, or improve people’s lives.
The results and findings from the data need to be communicated clearly, so that the people who asked the
question or wanted something researched can easily understand what the results of the data show.
When you write a report, remember to bear in mind the person who will be reading the report. This will help you
to use the appropriate language and words so that the reader will be able to understand the report. Use clear,
simple sentences and organise your findings into logical paragraphs. At the beginning of the report, tell the
reader what you are trying to find out or what question you are hoping to answer with insights from the data. At
the end of the report, write a short summary of the key findings from the data, and draw conclusions about what
the data tells you.
Test yourself now
High marks in science are the key to your success and future plans. Test yourself and learn more on Siyavula Practice.
Sign up and test yourself
Exercise 20.1
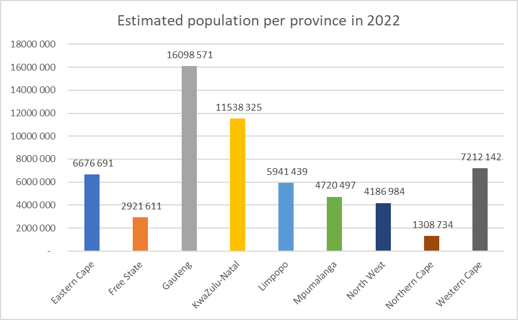
The table shows the estimated population for each province in South Africa in 2022.
| Province |
Estimated Population |
| Free State |
\(2\ 921\ 611\) |
| Northern Cape |
\(1\ 308\ 734\) |
| Gauteng |
\(16\ 098\ 571\) |
| KwaZulu-Natal |
\(11\ 538\ 325\) |
| Western Cape |
\(7\ 212\ 142\) |
| Eastern Cape |
\(6\ 676\ 691\) |
| Limpopo |
\(5\ 941\ 439\) |
| Mpumalanga |
\(4\ 720\ 497\) |
| North West |
\(4\ 186\ 984\) |
Data source: https://www.statssa.gov.za/publications/P0302/P03022022.pdf
- How many provinces does South Africa have?
- Which province has the largest estimated population?
- Which province has the smallest estimated population?
- What is the total estimated population of South Africa?
-
Calculate the average estimated population for the provinces.
- \(9\) provinces
- Gauteng \(16\ 098\ 571\)
- Northern Cape \(1\ 308\ 734\)
-
\[60\ 604\ 994\]
- The average population for the provinces is \(6\ 733\ 888\).
The pie chart and bar graph below show the data from Exercise 20.1.
- Which graph do you think makes the data easier to read and interpret?
- Which graph do you think makes it easier to compare between the estimated populations of different
provinces?
- What do you think are some of the disadvantages of a pie chart?
- How would you show the average population on the bar graph?
- Use the graphs and your calculations in Exercise 20.1 to summarise the data in a few short sentences.
- Design a data collection tool for recording the favourite types of music of each of your classmates or
friends.
- Record, organise, summarise and represent data on the favourite types of music of each person you ask.
- Analyse the data to determine which types of music are the most popular and which are the least popular.
- Write a short report summarising your findings from the data. Present your findings to the rest of the
class.