19.2 Bar graphs
Bar graphs are used to display data that has been collected and organised according to categories.
Data that can be represented in categories is called discrete data. Discrete data values are individual, separate values that can be counted. For example, we can use the categories of brown, green or blue eye colour, and then count how many people in a room have these eye colours. Other examples of discrete data are the number of learners in a class, the number of emails sent in one day or the number of patients at a clinic.
For discrete data, we only use integers. This is because you can’t have \(\text{4,5}\) people with green eyes, or \(\text{23,4}\) learners in a class, for example.
The other type of data that we use in statistics is continuous data, which is collected by measuring. Continuous data can have any value, which can change over time (so the values can be represented by real numbers). Examples of continuous data are the height or mass of a person, the distance travelled by a car, or the duration of a phone call. We will look at continuous data later in this chapter.
- discrete data
- data that is counted and can be represented by integers
- continuous data
- data that is collected by measuring; can be represented by any value (which can change over time)
A bar graph is a chart that uses either horizontal or vertical bars to show how categories compare with each other. The length of each bar shows the value that the bar represents.
Bar graphs usually have a gap between each category bar to make it easier to see the different categories.
Worked Example 19.1: Reading information from a bar graph
The school tuckshop staff kept a record of how many hot dogs, sandwiches, salads and burgers they sold in one day. The bar graph represents the data they collected.
Use the bar graph to answer the following questions:
- How many hot dogs did they sell?
- Which was the most popular item?
- Which was the least popular item?
- How many more sandwiches than salads did they sell?

Use the bar graph to determine how many hot dogs were sold.
Read off the value from the vertical axis. The tuckshop staff sold \(15\) hot dogs.
Use the bar graph to determine the most popular item.
The most popular item will be the highest bar in the graph. Sandwiches were the most popular item.
Use the bar graph to determine the least popular item.
The least popular item will be the lowest bar in the graph. Salads were the least popular item.
Use the bar graph to determine how many more sandwiches than salads were sold.
Reading the values off the vertical axis, we can see that \(35\) sandwiches and \(10\) salads were sold.
\(35 − 10 = 25\), so there were \(25\) more sandwiches sold than salads.
Worked Example 19.2: Drawing a bar graph from a table of values
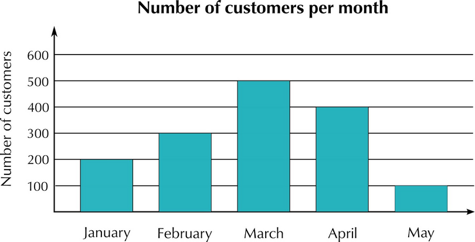
A spaza shop collected data about how many customers visited every month. Draw a bar graph for the data given in the table.
| Month | Number of customers |
|---|---|
| January | \(200\) |
| February | \(300\) |
| March | \(500\) |
| April | \(400\) |
| May | \(100\) |
Identify categories for the horizontal axis.
The table gives the number of customers per month for the first five months of the year. We will use these five months as the categories on the horizontal axis.
Determine a suitable scale for the vertical axis.
First, we need to determine the range of values for the number of customers. The lowest value is \(100\) and the highest value is \(500\). So for the vertical axis we can use a scale from \(0\) to \(600\) with intervals of \(100\).
Draw the bar graph.
Remember to label the categories, the scale, the axes and to give the graph an appropriate heading. Draw each bar to the correct height using the data in the table.
Double bar graphs
A double bar graph represents data for two data groups on the same chart.
Worked Example 19.3: Drawing a double bar graph from a table of values
Use the information in the table to draw a double bar graph.
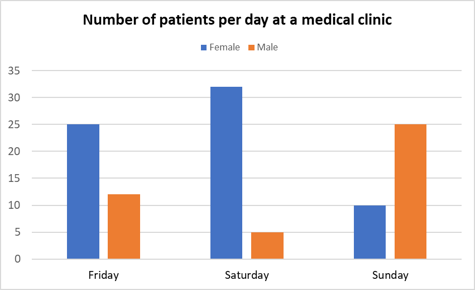
Number of patients per day at a medical clinic
| Female patients | Male patients | |
|---|---|---|
| Friday | \(25\) | \(12\) |
| Saturday | \(32\) | \(5\) |
| Sunday | \(10\) | \(25\) |
Identify categories for the horizontal axis.
The table of values gives the number of patients per day at a medical clinic for three days. We will use these three days as the categories on the horizontal axis.
The data has been split into two data sets: female patients and male patients. We will use blue bars to represent data for the female patients and orange bars for the male patients.
Determine a suitable scale for the vertical axis.
First, we need to determine the range of values for the number of patients. The lowest value is \(5\) and the highest value is \(32\). So for the vertical axis, we can use a scale from \(0\) to \(35\) with intervals of \(5\).
Use the data to draw a double bar graph.
Remember to show a key on the graph that indicates which colours represent the different data sets.