Home Practice
For learners and parents For teachers and schools
Textbooks
Full catalogue
Leaderboards
Learners Leaderboard Classes/Grades Leaderboard Schools Leaderboard
Pricing Support
Help centre Contact us
Log in

We think you are located in United States. Is this correct?

End of chapter exercises

End of chapter exercises

Textbook Exercise 10.7

Jane invested in the stock market. The probability that she will not lose all her money is \(\text{0,32}\). What is the probability that she will lose all her money? Explain.

Since the events “Jane will lose all her money” and “Jane will not lose all her money” are complementary events, their probabilities sum to \(\text{1}\). Therefore the probability that Jane will lose all her money is \(1 - \text{0,32} = \text{0,68}\).

If \(D\) and \(F\) are mutually exclusive events, with \(P(\text{not } D) = \text{0,3}\) and \(P(D \text{ or } F) = \text{0,94}\), find \(P(F)\).

Since \(D\) and \(F\) are mutually exclusive, the sum rule for mutually exclusive events applies: \[P(D \text{ or } F) = P(D) + P(F)\] We are given \(P(\text{not } D) = \text{0,3}\), therefore \(P(D) = 1 - \text{0,3} = \text{0,7}\). From the sum rule we have \begin{align*} P(F) &= P(D \text{ or } F) - P(D) \\ &= \text{0,94} - \text{0,7} \\ &= \text{0,24} \end{align*}

A car sales person has pink, lime-green and purple models of car \(A\) and purple, orange and multicolour models of car \(B\). One dark night a thief steals a car.

What is the experiment and sample space?

The experiment is the outcome of selecting a particular model and colour car from the sample space of available cars.

The sample space is \(\{\)pink model \(A\); lime-green model \(A\); purple model \(A\); purple model \(B\); orange model \(B\); multicolour model \(B\)\(\}\).

What is the probability of stealing either a model of \(A\) or a model of \(B\)?

Since there are only two models, namely \(A\) and \(B\), the probability of stealing one of the two models is \(\text{1}\).

What is the probability of stealing both a model of \(A\) and a model of \(B\)?

Since there is no overlap between the two models and since the thief steals only one car, the probability of stealing both of the models is \(\text{0}\).

The probability of event \(X\) is \(\text{0,43}\) and the probability of event \(Y\) is \(\text{0,24}\). The probability of both occurring together is \(\text{0,10}\). What is the probability that \(X\) or \(Y\) will occur?

From the addition rule \begin{align*} P(X \text{ or } Y) &= P(X) + P(Y) - P(X \text{ and } Y) \\ &= \text{0,43} + \text{0,24} - \text{0,10} \\ &= \text{0,57} \end{align*}

\(P(H) = \text{0,62}\); \(P(J) = \text{0,39}\) and \(P(H \text{ and } J) = \text{0,31}\). Calculate:

\(P(H')\)
\(P(H') = 1-P(H) = 1-\text{0,62} = \text{0,38}\)
\(P(H \text{ or } J)\)

From the addition rule: \begin{align*} P(H\text{ or }J) &= P(H) + P(J) - P(H\text{ and }J) \\ &= \text{0,62} + \text{0,39} - \text{0,31} \\ &= \text{0,7} \end{align*}

\(P(H' \text{ or } J')\)

We draw a Venn diagram to get an idea of what the event \((H' \text{ or } J')\) looks like.

\(H'\) \(J'\) \(H' \text{ or } J'\)
6d94df5c7fbb273f090216444c373892.png c8ba9c379d3d3d9c3893f8d46b5629e4.png 433b4622cfb753993da1bc7dd4d36557.png

From the third diagram above we can see that \begin{align*} P(H' \text{ or } J') &= 1 - P(H\text{ and }J) \\ &= \text{0,69} \end{align*}

\(P(H' \text{ or } J)\)

We draw a Venn diagram to get an idea of what the event \((H' \text{ or } J)\) looks like.

\(H'\) \(J\) \(H' \text{ or } J\)
6d94df5c7fbb273f090216444c373892.png f8c1d08bbfe1ebd60aa6d686594a63b8.png bb7cfa7509d7e18b0a0873e09677082b.png

From the third diagram above we can see that \begin{align*} P(H' \text{ or } J) &= P(H') + P(H\text{ and }J) \\ &= \text{0,38} + \text{0,31} \\ &= \text{0,69} \end{align*}

\(P(H' \text{ and } J')\)

We draw a Venn diagram to get an idea of what the event \((H' \text{ and } J')\) looks like.

\(H'\) \(J'\) \(H' \text{ and } J'\)
6d94df5c7fbb273f090216444c373892.png c8ba9c379d3d3d9c3893f8d46b5629e4.png ac6acaf0108eb50a790e8ffdee35d67f.png

From the third diagram above we can see that \begin{align*} P(H' \text{ and } J') &= 1 - P(H\text{ or }J) \\ &= \text{0,3} \end{align*}

The last ten letters of the alphabet are placed in a hat and people are asked to pick one of them. Event \(D\) is picking a vowel, event \(E\) is picking a consonant and event \(F\) is picking one of the last four letters. Draw a Venn diagram showing the outcomes in the sample space and the different events. Then calculate the following probabilities:

\(P(\text{not } F)\)

The Venn diagram is shown below. (Note that Y is not a vowel.)

beb96b0ff259d80368661e44331cafac.png

We can then read off all the required probabilities.

\(P(\text{not } F) = 1 - \frac{4}{10} = \frac{3}{5}\)

\(P(F \text{ or } D)\)
\(\frac{5}{10} = \frac{1}{2}\)
\(P(\text{neither } E \text{ nor } F)\)

This leaves only the outcomes in \(D\), so \(P(\text{neither } E \text{ nor } F) = \frac{1}{10}\).

\(P(D \text{ and } E)\)
\(\text{0}\) since \(D\) and \(E\) are mutually exclusive.
\(P(E \text{ and } F)\)
\(\frac{4}{10} = \frac{2}{5}\)
\(P(E \text{ and } D')\)

Since \(D\) and \(E\) are complementary (a letter is either a vowel or a consonant), \(D' = E\), so \(P(E \text{ and } D') = P(E \text{ and } E) = P(E) = \frac{9}{10}\).

Thobeka compares three neighbourhoods (we'll call them \(A\), \(B\) and \(C\)) to see where the best place is to live. She interviews \(\text{80}\) people and asks them whether they like each of the neighbourhoods, or not.

  • \(\text{40}\) people like neighbourhood \(A\).
  • \(\text{35}\) people like neighbourhood \(B\).
  • \(\text{40}\) people like neighbourhood \(C\).
  • \(\text{21}\) people like both neighbourhoods \(A\) and \(C\).
  • \(\text{18}\) people like both neighbourhoods \(B\) and \(C\).
  • \(\text{68}\) people like at least one neighbourhood.
  • \(\text{7}\) people like all three neighbourhoods.
Use this information to draw a Venn diagram.

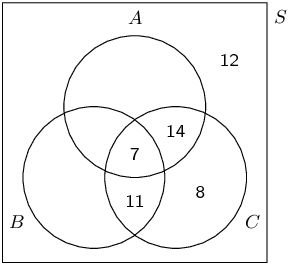
We first draw the outline of the Venn diagram.

2739c808f6525c7b823e8448564289e7.png

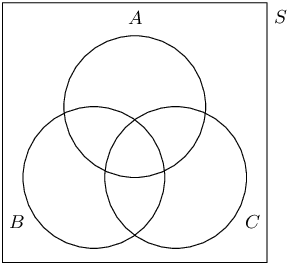
Next, we determine the counts of the different regions in the diagram, using the information provided.

  • There are \(\text{7}\) people who like all three neighbourhoods, so \(n(A\text{ and }B\text{ and }C) = 7\).
  • There are \(\text{21}\) people who like \(A\) and \(C\), so \(n(A\text{ and }C) = 21\).
  • There are \(\text{18}\) people who like \(B\) and \(C\), so \(n(B\text{ and }C) = 18\).
  • There are \(\text{40}\) people who like \(C\), so \(n(C) = 40\).
  • Since \(\text{68}\) people like at least one neighbourhood and since there are \(\text{80}\) people in total, \(\text{12}\) people like none of the neighbourhoods.

Using the above information we can complete part of the Venn diagram.

89491e50e36b773f212062266a1e90b1.png

Since \(n(A\text{ or }B\text{ or }C) = 68\), we can see from the diagram above that \(n(A\text{ or }B) = 60\). From the sum rule \[n(A\text{ and }B) = n(A) + n(B) - n(A\text{ or }B) = 40 + 35 - 60 = 15\] This allows us to complete the diagram:

9a859a1b2ff44ded113e65239677cbd9.png
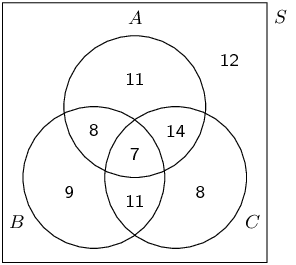
How many people like none of the neighbourhoods?
\(\text{12}\)
How many people like neighbourhoods \(A\) and \(B\), but not \(C\)?
\(\text{8}\)
What is the probability that a randomly chosen person from the survey likes at least one of the neighbourhoods?
\(P(A\text{ or }B\text{ or }C) = \frac{68}{80} = \frac{17}{20}\)

Let \(G\) and \(H\) be two events in a sample space. Suppose that \(P(G) = \text{0,4}\); \(P(H) = h\); and \(P(G \text{ or } H) = \text{0,7}\).

For what value of \(h\) are \(G\) and \(H\) mutually exclusive?

\(G\) and \(H\) are mutually exclusive when \(P(G \text{ and } H) = 0\).

From the sum rule we have \[P(G \text{ or } H) = P(G) + P(H) - P(G \text{ and } H)\] By substituting in the given values and \(P(G \text{ and } H) = 0\), we get \[\text{0,7} = \text{0,4} + h - 0\] Therefore \(h = \text{0,3}\).

For what value of \(h\) are \(G\) and \(H\) independent?

\(G\) and \(H\) are independent when \(P(G \text{ and } H) = P(G) \times P(H)\).

From the sum rule we have \[P(G \text{ or } H) = P(G) + P(H) - P(G \text{ and } H)\] By substituting in the given values and \(P(G \text{ and } H) = P(G) \times P(H)\), we get \begin{align*} \text{0,7} &= \text{0,4} + h - \text{0,4} \times h \\ \text{0,3} &= \text{0,6} \times h \end{align*} Therefore \(h = \text{0,5}\).

The following tree diagram represents points scored by two teams in a soccer game. At each level in the tree, the points are shown as (points for Team \(\text{1}\); points for Team \(\text{2}\)).

e66148406e6423db85746b946ba7de49.png

Use this diagram to determine the probability that:

Team \(\text{1}\) will win

The outcomes where Team 1 wins (when the first score is greater than the second score) are underlined in the tree diagram below.

fa74da92582e16508dbd3be27d25de50.png

We compute the probability of Team 1 winning by multiplying the probabilities along each path and adding them up. \begin{align*} \text{0,52} \times \text{0,65} \times \text{0,75} &= \text{0,2535} \\ \text{0,52} \times \text{0,65} \times \text{0,25} &= \text{0,0845} \\ \text{0,48} \times \text{0,4} \times \text{0,5} &= \text{0,096} \\ \\ \text{0,2535} + \text{0,0845} + \text{0,096} &= \underline{\text{0,434}} \end{align*}

The game will be a draw

The outcomes where the game is a draw (when the first score equals the second score) are underlined in the tree diagram below.

418ec741277f34ccb895bae80774bdd5.png

There is only one such outcome and so the probability of a draw is the product of the probabilities along the path. \[\text{0,52} \times \text{0,35} = \text{0,182}\]

The game will end with an even number of total points

The outcomes where the sum of the points is even are underlined in the tree diagram below.

1afc28ffec6882bd645c5ba89585caee.png

\begin{align*} \text{0,52} \times \text{0,35} &= \text{0,182} \\ \text{0,48} \times \text{0,6} &= \text{0,288} \\ \\ \text{0,182} + \text{0,288} &= \underline{\text{0,47}} \end{align*}

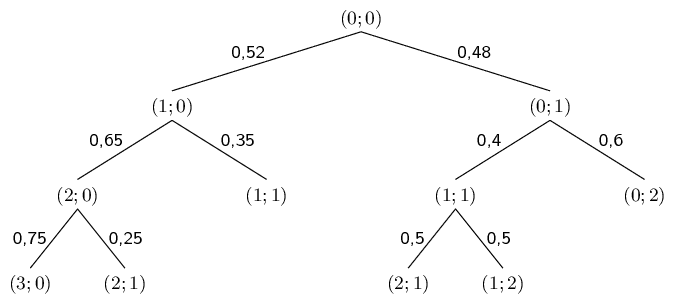
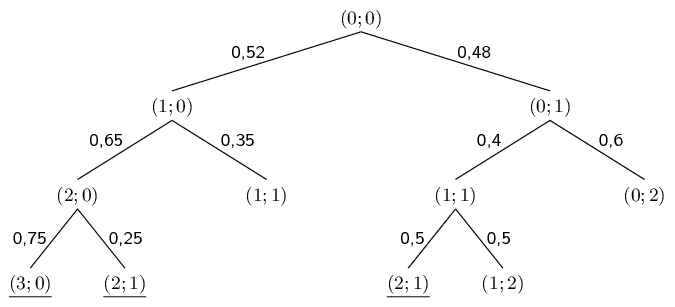
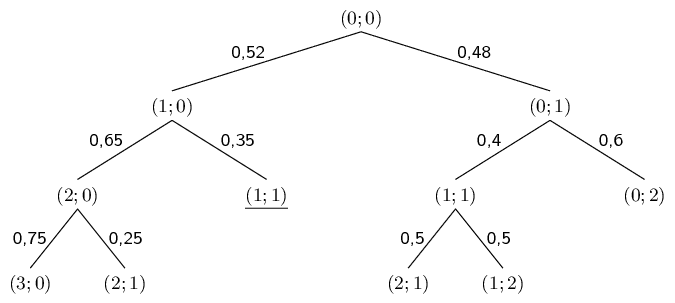
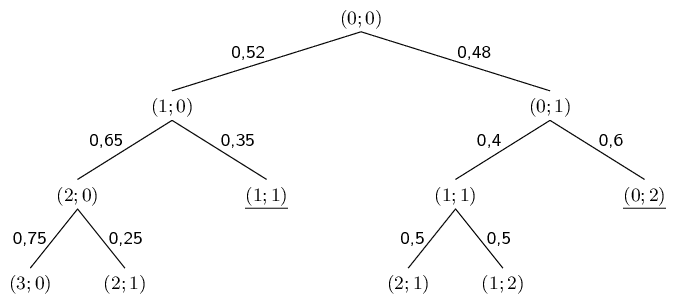
A bag contains \(\text{10}\) orange balls and \(\text{7}\) black balls. You draw \(\text{3}\) balls from the bag without replacement. What is the probability that you will end up with exactly \(\text{2}\) orange balls? 
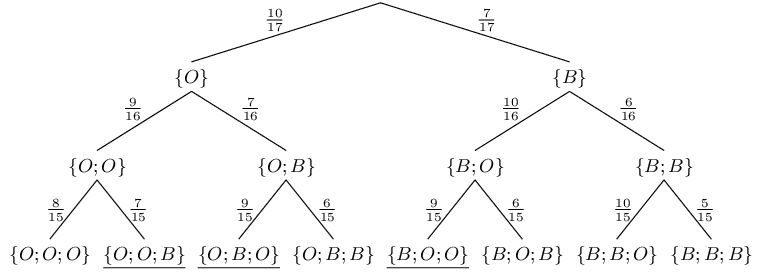
Represent this experiment using a tree diagram.

The tree diagram for the experiment is shown below. Since balls are drawn without replacement, the total number of balls (which appears in the denominators of the fractions) decreases by \(\text{1}\) at each step. Depending on whether the ball drawn was orange or black, the numerator either decreases by \(\text{1}\) or stays the same. The outcomes containing exactly \(\text{2}\) orange balls are underlined.

8e5d86655dddd9fce14ae5f0739a8c1b.png

Complete the following contingency table and determine whether the events are dependent or independent.

Durban Bloemfontein Totals
Liked living there \(\text{130}\) \(\text{30}\)
Did not like living there \(\text{140}\) \(\text{340}\)
Totals \(\text{230}\) \(\text{500}\)

We complete the contingency table by making sure that all the rows and columns sum to the correct totals.

Durban Bloemfontein Totals
Liked living there \(\text{130}\) \(\text{30}\) \(\text{160}\)
Did not like living there \(\text{140}\) \(\text{200}\) \(\text{340}\)
Totals \(\text{270}\) \(\text{230}\) \(\text{500}\)

Since

  • \(P(\text{Durban}) = \frac{270}{500} = \text{0,54}\);
  • \(P(\text{liked living there}) = \frac{160}{500} = \text{0,32}\);
  • \(P(\text{Durban and liked living there}) = \frac{130}{500} = \text{0,26}\);
and since \(\text{0,54} \times \text{0,32} = \text{0,1728} \ne \text{0,26}\) the events are dependent.

Summarise the following information about a medical trial with \(\text{2}\) types of multivitamin in a contingency table and determine whether the events are dependent or independent.

  • \(\text{960}\) people took part in the medical trial.
  • \(\text{540}\) people used multivitamin \(A\) for a month and \(\text{400}\) of those people showed an improvement in their health.
  • \(\text{300}\) people showed an improvement in health when using multivitamin \(B\) for a month.

If the events are independent, it means that the two multivitamins have the same effect on people. If the events are dependent, it means that one multivitamin is better than the other. Which multivitamin is better than the other, or are the both equally effective?

From the information in the problem, we can draw up the following partially completed contingency table.

Multivitamin \(A\) Multivitamin \(B\) Totals
Improvement in health \(\text{400}\) \(\text{300}\)
No improvement in health
Totals \(\text{540}\) \(\text{960}\)

We complete the table by ensuring that all rows and columns add up to the correct totals.

Multivitamin \(A\) Multivitamin \(B\) Totals
Improvement in health \(\text{400}\) \(\text{300}\) \(\text{700}\)
No improvement in health \(\text{140}\) \(\text{120}\) \(\text{260}\)
Totals \(\text{540}\) \(\text{420}\) \(\text{960}\)

Since

  • \(P(\text{Multivitamin A}) = \frac{540}{960} = \frac{9}{16}\);
  • \(P(\text{Improvement in health}) = \frac{700}{960} = \frac{35}{48}\);
  • \(P(\text{Multivitamin A and Improvement in health}) = \frac{400}{960} = \frac{5}{12}\);
and since \(\frac{9}{16} \times \frac{35}{48} = \frac{105}{256} \ne \frac{5}{12}\) the events are dependent.

With Multivitamin A, \(\frac{400}{540} = \text{74,1}\%\) of the people showed an improvement in health. With Multivitamin B, \(\frac{300}{420} = \text{71,4}\%\) of the people showed an improvement in health. Therefore Multivitamin A is more effective than Multivitamin B.